7 Essential Tips for Optimizing Your Industrial Powder Paint Oven for Peak Performance
When it comes to electrostatic powder coating production lines, most manufacturers focus heavily on the spray booth and powder recovery system—but they often overlook one of the most critical factors in achieving consistent, high-quality coatings: the curing oven.
I've worked with hundreds of manufacturing facilities across cabinet making, outdoor furniture, and aluminum extrusion industries, and I can tell you that roughly 60% of coating quality issues don't originate from poor spraying technique or powder formulation. They stem from inadequate curing oven performance and improper thermal management. Yet many operators treat the oven as a "set it and forget it" component.
The truth is, your curing oven is where coating destiny is sealed. Whether your finished product has flawless adhesion, uniform gloss, and durability—or whether it suffers from poor hardness, color inconsistency, and premature failure—is largely determined by what happens inside that box.
In this guide, I'm sharing seven optimization strategies we've refined through real factory experience. These aren't theoretical concepts. They're practical adjustments that manufacturers at our client facilities have implemented within 2-3 weeks to achieve measurable improvements in film thickness consistency, defect rates, and energy efficiency—without major capital investment.

Understanding Your Powder Paint Oven: Core Function and Performance Metrics
Before diving into optimization strategies, let's establish what a powder paint oven actually does—and what we should measure to confirm it's working correctly.
A powder coating curing oven isn't simply an industrial dryer. It's a chemical transformation chamber. When powder-coated workpieces enter the oven, the powder goes through three distinct phases:
Melt phase: Powder particles soften and flow across the workpiece surface.
Flow-out phase: The coating becomes continuous and uniform, filling microscopic surface irregularities.
Crosslinking phase: The polymer undergoes chemical reaction, forming molecular bonds that create hardness, adhesion, and durability.
This entire process is temperature-dependent and time-dependent. Get the thermal profile wrong, and you're either leaving coating molecules in an incomplete state (undercure) or degrading them through excess heat (overcure).
Key Performance Metrics You Should Track
Most facilities measure air temperature inside the oven using a single thermocouple mounted near the heating element or exhaust outlet. This is fundamentally misleading.
What actually matters is workpiece temperature—not ambient air temperature. A heavy steel cabinet or thick aluminum extrusion will reach cure temperature much more slowly than the surrounding air. If you're relying on air temperature alone, lighter components may overcure while heavier ones undercure.
Additionally, temperature uniformity matters enormously. If the oven's hot side reaches 200°C while the cool side reaches 170°C, parts entering from different positions will experience entirely different cure kinetics. This is why film thickness, hardness, and gloss consistency suffer.
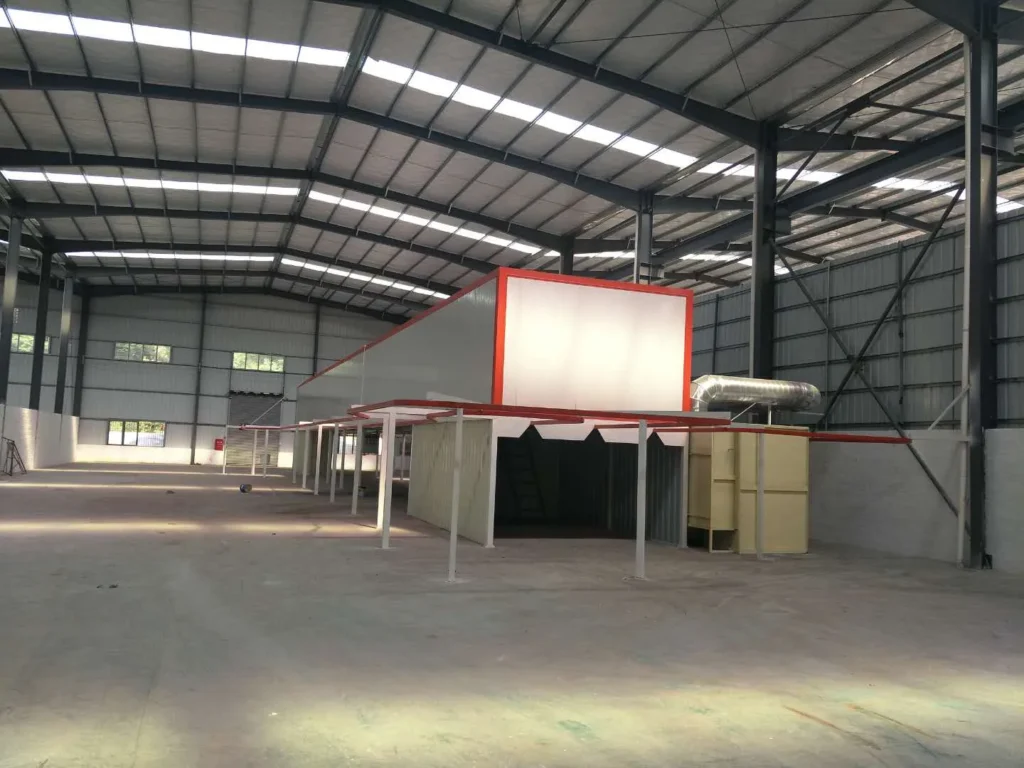
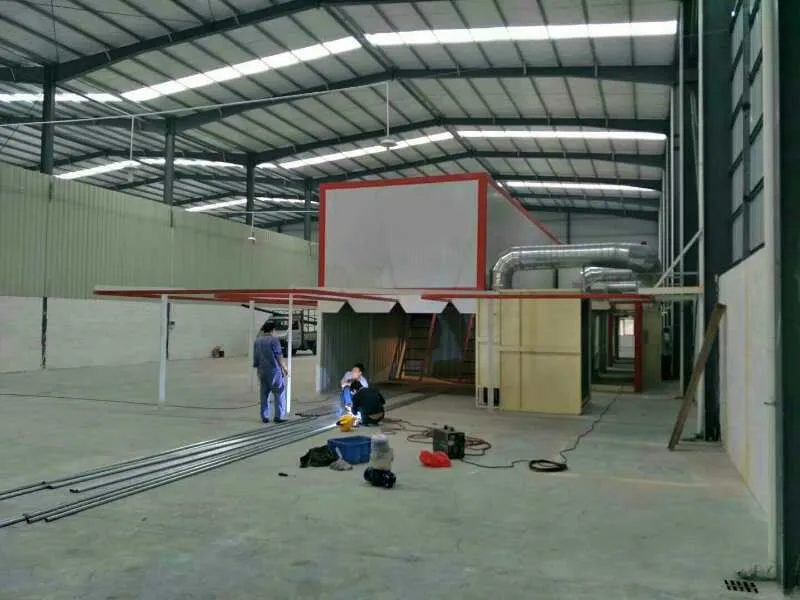 powder coating oven temperature distribution" />
Tip 1: Master Temperature Control – Measure Workpiece Temperature, Not Just Air Temperature
This is where most curing problems begin.
Your control cabinet display shows 200°C, so you assume the workpiece is reaching cure specification. But in reality, that measurement is tracking oven air temperature—not the temperature at the part surface or, critically, the part interior.
The Thermal Lag Problem
Thick or dense workpieces—especially steel cabinets, cast aluminum components, or multi-layer assemblies—have high thermal mass. Heat must conduct inward from the surface. If line speed is too fast or workpiece geometry is unfavorable, the interior may never reach full cure temperature during the dwell time.
At one of our cabinet-manufacturing partners, we found that 35% of products leaving the oven had hardness readings 15–20 points below specification. Initial diagnosis suggested powder formulation problems. Reality: they were measuring air temperature at 200°C, but actual part surface temperature was only 185°C due to poor airflow contact and fast line speed.
Practical Solution
Install a secondary temperature monitoring point inside or on the surface of a representative workpiece. Use a thermocouple or infrared temperature gun to verify real part temperature during a test run.
For batch ovens, place a dummy workpiece (same material, similar mass to your typical part) inside the oven and monitor its temperature rise during a full cure cycle. Record both the ramp-up time and the stabilization time.
For conveyor ovens, use a calibrated infrared thermometer to spot-check workpiece surface temperature at the oven exit. Do this weekly, at minimum. If surface temperature lags more than 10–15°C behind setpoint, investigate:
- Is the airflow system functioning optimally?
- Is line speed appropriate for part mass?
- Are heating elements maintaining consistent output?
Why This Matters
Undercure manifests as poor adhesion, low mechanical hardness, and reduced salt spray resistance—often appearing only weeks or months after production. By then, the parts are in the field. Overcure can yellow the coating, increase brittleness, and waste energy. Both reduce profitability and damage reputation.
Tip 2: Optimize Heating Curves and Dwell Time Based on Material and Part Geometry
Powder coating cure isn't a one-size-fits-all process. Different powder systems, part materials, and workpiece geometries require different thermal profiles.
Understanding Cure Windows
Every thermosetting powder has a cure window—the temperature range and time duration within which crosslinking occurs optimally. For example:
- Polyester powder: typically 160–190°C, 10–15 minutes
- Epoxy powder: typically 150–180°C, 10–20 minutes
- Polyurethane powder: typically 140–170°C, 15–30 minutes
But these are general guidelines. The actual cure window for your specific powder, applied at your specific film thickness, on your specific part geometry, may differ.
The Heating Curve Matters More Than You Think
If you blast workpieces from room temperature directly to 190°C in 2 minutes, you risk:
- Volatile organic emissions from powder components
- Uneven flow and leveling
- Surface cratering or bubbling
- Color variations
A more gradual ramp—reaching 100–120°C over 5–7 minutes, then continuing to final cure temperature—allows powder to melt uniformly, volatiles to escape gradually, and the coating to flow and level properly before final crosslinking.
Geometry-Specific Adjustments
Thin stampings and hollow components cure much faster than thick, solid parts. If your line runs a mix of geometries:
- For thin parts: shorter dwell time (8–10 min), slightly lower final temp
- For thick parts: longer dwell time (15–20 min), confirm interior temp reaches spec
- For complex shapes: ensure airflow reaches all surfaces; consider rotating or repositioning fixtures to improve thermal contact
Field Data Collection
At our facilities, we recommend operators keep a simple log:
| Part Type | Ambient Temp | Setpoint | Measured Surface Temp at Exit | Dwell Time | Hardness Reading | Notes |
|---|---|---|---|---|---|---|
| Cabinet (steel) | 22°C | 200°C | 188°C | 15 min | 8H | Acceptable |
| Aluminum profile | 22°C | 185°C | 175°C | 12 min | 7H | Undercure risk |
| Sheet metal | 22°C | 195°C | 192°C | 10 min | 9H | Optimal |
This data, collected over 2–4 weeks, reveals whether your current curve is truly optimized or whether adjustments could improve consistency.
Tip 3: Ensure Uniform Temperature Distribution Through Air Circulation System Management
One of the most overlooked maintenance items in powder coating facilities: the oven's air circulation system.
How Thermal Stratification Kills Consistency
If hot air preferentially reaches one side of the oven chamber—say, the left half receives 210°C while the right half receives 175°C—parts exiting from different positions experience different cure profiles. You'll see color variations, gloss inconsistencies, and hardness spreads across a single batch.
This stratification typically develops because:
- Supply air vanes are partially blocked by dust, powder accumulation, or debris
- Return air vents are restricted, causing backpressure and uneven discharge
- Circulation fan is losing efficiency due to bearing wear or blade corrosion
- Ductwork has developed leaks or disconnections
Diagnostic Check: Temperature Mapping
At minimum quarterly—more often in high-humidity or high-dust environments—perform a simple temperature map:
- Preheat the oven to setpoint and stabilize for 15 minutes.
- Place 5–6 thermocouple probes or dummy workpieces at different horizontal and vertical positions inside the chamber (corners, center, top, bottom).
- Record temperatures simultaneously after 5 minutes of stable operation.
- Acceptable variance: ±5°C across the chamber. If variance exceeds ±10°C, investigate.
Circulation System Maintenance Protocol
| Maintenance Item | Frequency | Action |
|---|---|---|
| Supply air vanes | Monthly | Inspect for powder accumulation; clean with compressed air |
| Return air filters/screens | Monthly | Check for blockage; replace if >30% occluded |
| Circulation fan bearings | Quarterly | Listen for grinding noise; check for unusual vibration |
| Ductwork inspection | Semi-annually | Check for visible gaps, corrosion, or loose connections |
| Full duct cleaning | Annually | Remove internal powder/dust accumulation |
| Fan blade condition | Annually | Inspect for corrosion, warping, or imbalance |
Real Impact
We worked with an aluminum extrusion facility experiencing 8–12% scrap due to color mottling. After mapping temperatures, we found a 22°C variance between the oven's inlet and outlet zones. The circulation fan was degraded. After bearing replacement and duct cleaning, variance dropped to 4°C, and scrap fell to <2%.
Tip 4: Prevent Curing Dead Zones – Design Your Loading Strategy Around Oven Airflow
This is where operator behavior and engineering intersect.
What Are Dead Zones?
Dead zones are regions inside the oven where airflow stagnates, creating pockets of insufficient thermal contact. Common dead zone locations:
- Behind tightly packed workpieces (blockages to airflow)
- In corners or recesses not directly exposed to supply air
- Under low-clearance fixtures where air cannot circulate
- At the oven entrance where cold incoming parts thermally shock the chamber
Why They Occur
Many operators load the oven as densely as possible to maximize throughput. While understandable, this strategy can backfire. If workpieces are packed too tightly:
- Supply air cannot reach internal surfaces
- Parts in the middle of a dense cluster remain cooler than exterior parts
- Cure becomes inconsistent across the load
Additionally, fixture design matters. Solid fixtures block airflow. Open-grid or slotted fixtures allow air to circulate around all workpiece surfaces.
Optimization Strategy
Analyze your oven's airflow pattern. This is typically from bottom to top and front to back, or in a circulation loop. Then, stagger loading to create air pathways:
- Increase spacing between parts by 10–15% if current defect rates exceed 3%
- Rotate fixtures 90° periodically during a shift to ensure no loading pattern favors one position
- Verify fixture design allows air access to all workpiece sides
- Mark optimal vs. problematic loading zones on the oven floor or loading jig
For heavy, thick parts, consider staging: place them in the oven entrance zone (cooler) first, allowing pre-heating. Move faster-curing components to the rear.
Example: Cabinet Factory Adjustment
A cabinet manufacturer was experiencing hard spots on ~5% of finished units. Investigation revealed operators were stacking cabinets too densely in the oven entrance, blocking airflow to the interior cabinet surfaces. By reducing entrance loading density by 20% and adding a pre-heating zone outside the oven (using infrared lamps), uniform cure improved to >98%.
Tip 5: Reduce Energy Consumption Without Sacrificing Curing Quality
Industrial ovens consume substantial electrical or fuel energy. But many facilities are wasteful without realizing it.
Energy Loss Pathways
-
Insulation degradation: Over time, insulation boards crack, gaps develop, and seals deteriorate. Exterior surface temperature tells the story. If the oven exterior is hot to touch (>45°C), insulation is failing.
-
Door seal leakage: Worn door gaskets allow heated air to escape. Visually inspect for cracks, hardening, or separation.
-
Continuous operation at full temperature: Many facilities run ovens 24/7 at setpoint, even during breaks or slow production periods. Idle energy waste is significant.
-
Inefficient heating element: Electric elements accumulate scale; fuel burners get dirty. Both reduce efficiency.
-
Excessive line speed: Running faster than necessary doesn't improve cure quality and forces the oven to work harder to maintain temperature.
High-Impact, Low-Cost Improvements
Insulation Audit:
- Measure exterior surface temperature with an infrared gun at 10 different locations.
- If average >50°C, insulation replacement is economically justified (ROI typically 12–18 months).
- If localized hot spots >60°C exist, repair those sections immediately (gaps, cracks).
Door Seal Inspection:
- Monthly visual check. Replace seals annually or if any cracks are visible.
- Cost: $200–500 per door. Savings: 5–10% of oven energy consumption.
Idle Management:
- Install a programmable timer or occupancy sensor. Reduce oven temperature by 40–50°C during breaks or slow periods.
- During cold startup, ramp gradually rather than blasting to full setpoint. Gradual ramp reduces stress on elements and improves thermal stability.
Heating Element Maintenance:
- Electric elements: Inspect for scale buildup. Clean annually with a soft brush.
- Fuel burners: Schedule annual professional cleaning and calibration.
Energy Consumption Benchmark
| Oven Type | Typical Power Consumption | Annual Cost (at $0.12/kWh) | Optimization Potential |
|---|---|---|---|
| 5m batch oven (electric) | 80–120 kW | $9,500–14,300 | 10–15% reduction |
| 10m conveyor (electric) | 150–250 kW | $18,000–30,000 | 12–18% reduction |
| Gas-fired oven | 500k–800k BTU/hr | $8,000–15,000/yr | 8–12% reduction |
At one of our partner facilities, implementing insulation upgrades, door seal replacement, and idle scheduling reduced annual energy spend by 18%, with a payback period of 14 months.
Tip 6: Implement a Predictive Maintenance Program to Prevent Unexpected Failures
Unexpected oven failure doesn't just cost repair dollars—it stops your entire coating line, delays shipments, and damages customer relationships.
Maintenance by Schedule vs. Condition
Most facilities operate on a reactive maintenance model: run the equipment until something fails, then fix it. This approach is expensive and disruptive.
A predictive maintenance approach monitors key indicators, identifies degradation early, and schedules maintenance during planned downtime.
Essential Monitoring Points
Daily Checks (operator responsibility):
- Visual: No visible cracks, gaps, or corrosion in oven exterior
- Auditory: No unusual grinding, squealing, or grinding from fan motor
- Tactile: Oven exterior should feel warm but not dangerously hot (target: <50°C)
- Functional: Temperature setpoint and actual temperature stabilize within ±5°C
Weekly Checks (technician responsibility):
- Air supply filter: Visually inspect for dust loading. If >30% occluded, replace.
- Exhaust outlet: Verify airflow is smooth and unobstructed (use a smoke test if available).
- Heating elements (electric): Check for visible discoloration, scaling, or cracks.
- Burner (gas): Listen for irregular ignition; check flame color (should be predominantly blue).
Monthly Checks:
- Temperature uniformity map (as described in Tip 3)
- Oven door operation: Opens/closes smoothly; no resistance or binding
- Thermocouple calibration: Verify control thermocouple reads within ±2°C of a calibrated reference probe
- Insulation integrity: Any new visible cracks or separated seams?
Quarterly Checks:
- Circulation fan bearing condition: No increase in vibration or noise; current draw stable
- Ductwork interior: Any new corrosion, powder accumulation, or leaks?
- Electrical connections: No signs of overheating (discoloration, burn marks)
Annual Checks:
- Professional heating system inspection (electric or fuel)
- Comprehensive ductwork cleaning
- Insulation assessment
- Element/burner replacement if efficiency metrics show degradation
- Full safety system test (overheat protection, interlocks, emergency shutdown)
Early Warning Signs
| Symptom | Likely Cause | Action |
|---|---|---|
| Temperature fluctuates ±20°C or more | Thermocouple drift, burner instability, or airflow obstruction | Calibrate thermocouple; service burner; check filters |
| Slow ramp-up to setpoint (>50 min from cold start) | Heating element degradation, fuel pressure low, or insulation failure | Check element resistance; service fuel system; inspect insulation |
| Cure results inconsistent despite same settings | Air circulation degradation, temperature stratification, or line speed drift | Temperature map; clean ductwork; verify conveyor speed |
| Visible rust or corrosion in oven chamber | Moisture ingress or inadequate drainage | Check drain plug and pathway; ensure oven maintains positive exhaust pressure |
Maintenance Log Template
Maintain a simple spreadsheet:
| Date | Check Type | Finding | Action Taken | Technician | Status |
|---|---|---|---|---|---|
| 2025-01-15 | Weekly filter | 25% dust load | Noted | John | OK |
| 2025-02-01 | Monthly map | 8°C variance | Increased circulation time | Sarah | Monitor |
| 2025-02-15 | Thermocouple | 3°C drift detected | Calibrated against reference | John | Resolved |
This log becomes invaluable for identifying patterns and planning long-term maintenance strategy.
Tip 7: Upgrade Your Control System for Precision and Data-Driven Optimization
If your oven still runs on an analog controller with a simple dial thermostat, you're flying blind.
The Gap Between Analog and Modern Control
Analog systems offer basic on/off or proportional heating control. They can't:
- Log historical temperature data
- Detect gradual drift or early failure indicators
- Optimize heating ramps based on ambient conditions
- Alert operators to out-of-spec conditions before parts are ruined
- Integrate with production planning systems
Modern PLC-based (Programmable Logic Controller) systems, by contrast, provide:
Precise setpoint management: ±1–2°C vs. ±5–10°C with analog
Temperature trending: Visualize performance over hours, days, or weeks
Predictive alerts: "Heating element efficiency is declining; schedule maintenance in 7 days"
Recipe storage: Save and recall optimal cure profiles for different powder types and part geometries
Data export: Capture production logs for quality audits and continuous improvement
Cost vs. Benefit
A modern PLC retrofit for a mid-size oven typically costs $3,000–8,000, depending on integration complexity. Benefits include:
- Reduced scrap: Consistent cure = fewer defects. At $50/unit scrap cost, even 2–3% scrap reduction justifies the investment.
- Energy savings: Optimized ramps and idle management save 10–15% annually.
- Downtime reduction: Predictive maintenance prevents 70–80% of unexpected failures.
- Data visibility: Production teams gain real-time insight into process performance.
Payback period: typically 12–24 months.
Implementation Path
- Audit your current system: Is it proportional heating, simple on/off, or already PLC-based?
- Document your requirements: What data do you need? Which decisions do you want automated?
- Engage a systems integrator: They'll design a retrofit that integrates with your existing oven hardware while adding control and monitoring capability.
- Phased rollout: Start with temperature logging and alerts. Add recipe management and predictive features next.
Example: Cabinet Manufacturer Retrofit
A mid-size cabinet shop upgraded from a 20-year-old analog control to a modern PLC system. Results within 6 months:
- Cure temperature consistency improved from ±8°C to ±2°C
- Scrap rate fell from 4.2% to 1.8%
- Annual energy cost decreased by 12%
- Preventive maintenance scheduling improved reliability from 87% to 98% uptime
Payback on the $6,500 retrofit: 18 months.
How to Verify Proper Curing and Adjust Your Process
Theory is fine, but how do you know—in real time, on the production floor—whether workpieces are actually curing properly?
Field Verification Methods
Hardness Testing (Pencil Hardness):
- Allow part to cool to room temperature (minimum 2 hours post-oven).
- Use a pencil hardness scale (H, 2H, 3H, 4H, etc.).
- Gently draw a pencil across the coating at a 45° angle, applying steady pressure.
- The hardness rating is the lowest pencil grade that doesn't scratch the coating.
- Target: typically 2H–3H for industrial polyester; 3H–4H for epoxy.
Adhesion Testing (Cross-Hatch or Pull-Off):
- Cross-hatch method: Score the coating in a grid pattern (1mm spacing) using a specialized tool. Apply tape over the area, then pull. If paint flakes away, adhesion is poor (undercure).
- Pull-off (ASTM D4541): More rigorous; requires a hydraulic pull-off adhesion tester. Typical spec: >5 MPa.
Mechanical Impact:
- Drop a steel ball (0.5 kg) from 1 meter onto the coated surface. Impact should not crack or flake the coating (undercure will show whitening or chipping).
Solvent Resistance:
- Soak a cloth in MEK (methyl ethyl ketone) or isopropanol.
- Rub the coated surface for 30–60 seconds.
- Well-cured coating should show minimal softening or color transfer (undercure will feel tacky or transfer color).
Adjusting Based on Results
| Test Result | Interpretation | Adjustment |
|---|---|---|
| Hardness <2H, poor adhesion, high scratch sensitivity | Undercure: insufficient time or temp | Increase oven setpoint by 5–10°C or extend dwell time by 2–3 min; verify part actually reaches temp |
| Coating yellowed, brittle, prone to chipping | Overcure: excess heat degrades polymers | Reduce setpoint by 5–10°C or shorten dwell time |
| Hardness varies across batch (some 2H, some 4H) | Temperature inconsistency: dead zones or airflow issues | Implement temperature mapping; optimize loading strategy; check air circulation system |
| Adhesion fails immediately after cure but improves after 24-48 hrs | Incomplete crosslinking at pack-out: parts cooled too rapidly | Allow longer cool-down time post-oven or extend dwell by 1–2 min |
Test Schedule
- Daily: At least one hardness test per production run or batch
- Weekly: Full adhesion test (cross-hatch) on 3–5 representative parts
- Monthly: Solvent resistance and mechanical impact tests on samples from different oven zones
- Quarterly: Formal pull-off adhesion testing (if equipment available) or third-party lab testing
Making the Right Decision: Optimization vs. Equipment Upgrade
At what point is optimizing an existing oven worth the effort, and when should you upgrade or replace?
Optimization Makes Sense If:
- Oven is 5–15 years old: Likely still has 5–10 years of useful life remaining
- Current defect rate is 3–8%: Optimization can typically reduce this to <1–2%
- Energy consumption is manageable but inconsistent: Better control and maintenance will improve efficiency by 10–20%
- Downtime is occasional, not chronic: If oven runs >95% of the time, optimization extends that further
- Capital budget is constrained: Optimization costs $2,000–15,000; replacement costs $50,000–300,000+
Equipment Upgrade/Replacement is Needed If:
- Oven is >20 years old: Repair costs become frequent; efficiency is poor
- Defect rate persists >8% despite optimization: Systemic thermal or mechanical failure likely
- Energy costs exceed 20% of production costs: Modern ovens are 25–40% more efficient
- Downtime exceeds 5% of available time: Chronic failures indicate end-of-life
- Current oven cannot meet new product specifications: New line requires tighter temperature control or faster throughput than existing system can deliver
Cost-Benefit Framework
| Scenario | Optimization Path | Upgrade Path |
|---|---|---|
| 10-year-old oven, 4% scrap, occasional failures | Invest $8,000–12,000 in PLC retrofit, maintenance, insulation upgrades | Not justified; optimization likely sufficient |
| 18-year-old oven, 6% scrap, frequent breakdowns, 50% energy cost | Invest $5,000–8,000 but plan replacement within 2–3 years | Consider phased upgrade; evaluate ROI vs. replacement |
| 25-year-old oven, 10% scrap, monthly failures, inefficient heating | Optimization unlikely to help; replacement justified | Replace with modern system; typical ROI 3–5 years |
Implementation Timeline
For optimization (8–12 weeks):
- Assess current condition (weeks 1–2)
- Implement low-cost fixes: seals, filters, basic control improvements (weeks 3–4)
- Deploy temperature mapping and predictive maintenance (weeks 5–8)
- Fine-tune cure parameters based on data (weeks 9–12)
For upgrade/replacement (16–24 weeks):
- Specification and vendor selection (weeks 1–4)
- Engineering and fabrication (weeks 5–16)
- Delivery and installation (weeks 17–20)
- Commissioning and operator training (weeks 21–24)
Key Takeaways
Your powder paint oven is the guardian of coating quality. It's also one of your most energy-intensive systems. Treating it as a passive component—something you set and forget—is a costly mistake.
The seven optimization strategies covered here represent the highest-impact interventions we've seen across hundreds of production facilities:
-
Measure actual workpiece temperature, not just oven air temperature, to catch undercure and overcure before they become scrap.
-
Optimize heating curves for your specific powder type, part material, and geometry. One cure profile doesn't fit all.
-
Ensure uniform temperature distribution through regular airflow system maintenance and ductwork inspection. Dead zones are silent killers.
-
Prevent curing dead zones by designing your loading strategy around oven airflow patterns, not just maximizing density.
-
Reduce energy consumption through insulation audit, door seal replacement, idle management, and heating element maintenance—typical payback within 12–24 months.
-
Implement predictive maintenance with a structured daily, weekly, monthly, and annual checklist. Catch failures before they stop your line.
-
Upgrade your control system to a modern PLC with temperature logging, recipe management, and predictive alerts. This is where data-driven optimization begins.
These aren't exotic techniques. They're disciplined, methodical adjustments that any manufacturing facility can implement. Most require no major capital investment—just structured attention and systematic execution.
The question isn't whether optimization is possible. The question is: How much are you currently leaving on the table by not implementing it?
If your current scrap rate is 4% and optimization cuts it to 1.5%, that's a 2.5% improvement on your coating line. Applied across your annual production volume, that typically translates to $50,000–300,000 in recovered value annually, depending on production scale.
That's why it's worth your attention.
Frequently Asked Questions
Q: How often should I recalibrate my oven thermocouple?
A: Quarterly as standard practice. If you notice temperature drifting >2°C, calibrate immediately. Thermocouples gradually drift with age and thermal cycling; this is normal.
Q: Can I achieve the same cure quality at lower temperatures if I extend dwell time?
A: Partially, but not completely. Cure kinetics are temperature-dependent. While some powder systems allow slight temperature reduction with time extension, going below the powder manufacturer's minimum temperature usually results in incomplete crosslinking. Always consult your powder supplier's technical datasheet for the approved cure window.
Q: What's the typical cost of oven insulation replacement?
A: For a mid-size conveyor oven (10m long), budget $4,000–10,000 depending on labor availability and material costs. ROI is typically 18–36 months through energy savings.
Q: Should I run my oven continuously, or is it okay to shut it down during breaks?
A: Shut it down during extended breaks (>2 hours). Modern ovens reach setpoint within 30–50 minutes from cold start if you use a gradual ramp. The energy saved during idle time typically exceeds the cost of ramp-up. Always verify your specific oven's ramp characteristics before establishing a routine.
Q: How do I know if my air circulation fan is failing?
A: Listen for grinding, squealing, or unusual vibration. Measure current draw on the fan motor—an increase of 10–15% from baseline indicates bearing wear. If temperature uniformity maps show growing stratification despite other systems functioning normally, suspect fan degradation.
Q: Is upgrading to a PLC system worth it for a small operation (producing <50 units/day)?
A: Yes, if current scrap rates or defect rates are >3%. Even small operations benefit from consistent temperature control and data visibility. The ROI calculation focuses on scrap reduction and energy savings, not production volume. A retrofit is usually justified within 18–24 months.
How We Can Help
At Ketu, we've worked with hundreds of manufacturers across cabinet making, outdoor furniture, aluminum extrusion, and precision metal fabrication to optimize their powder coating systems. We understand that every facility is different—different products, different constraints, different goals.
If you're experiencing inconsistent cure quality, high scrap rates, or energy costs that feel out of control, we'd like to help you diagnose the root cause and develop a practical improvement roadmap.
Whether your focus is immediate optimization or planning a longer-term equipment upgrade, we can provide:
- On-site oven assessment and temperature mapping analysis
- Customized maintenance protocols and operator training
- PLC retrofit design and commissioning support
- Replacement equipment specification and engineering support
- Complete installation, commissioning, and support
Many of our clients have seen measurable improvements—scrap reduction of 60–80%, energy cost reduction of 12–20%, and uptime improvement to >98%—within 8–12 weeks of implementing an optimization roadmap.
If you'd like to explore what's possible for your operation, we're ready to listen and help.
Contact us today for a no-cost initial consultation:
WhatsApp: +8618064668879
Email: ketumachinery@gmail.com
Let's turn your powder paint oven from a cost center into a competitive advantage.