Powder Recycling Technology in Powder Coating Equipment: Current Status and Future Prospects
Introduction
Powder recycling has become one of the most critical drivers of cost efficiency and sustainability in electrostatic powder coating operations. From my experience working directly with coating lines across cabinet manufacturing, outdoor furniture, and aluminum extrusion industries, I can tell you that recovery efficiency isn't just an environmental checkbox—it's the difference between a profitable production line and one bleeding margin every single day.
The reason I'm writing this article is straightforward: most buyers and operators don't fully understand what "recovery rate" actually means, how different technologies compare in real conditions, or why choosing the wrong recovery system can sabotage an otherwise well-designed line. We've seen clients invest in high-end spray booths and curing ovens, only to watch their bottom line get crushed by poor powder utilization. That's where recycling technology enters the picture.
Current powder recovery systems typically achieve 85–95% separation efficiency depending on technology type and operating conditions. However, there's a critical gap between "surface recovery rate" (what falls into the collection hopper) and "effective recovery rate" (powder that actually gets reused without degradation). Understanding this distinction is essential for making informed decisions about equipment investment and operational costs.
This article covers the state of powder recycling technology as we see it in the field, the three mainstream recovery methods in use today, real-world efficiency benchmarks, the factors that actually impact performance, cost analysis from installation through ROI, and where the technology is heading. Whether you're evaluating a new coating line or trying to optimize an existing one, the insights here come from years of direct involvement with these systems.
What Is Powder Recycling Technology and Why It Matters in Powder Coating
The Core Function
Powder recycling is the process of capturing and separating airborne powder particles that fail to land on the workpiece during electrostatic spraying, then returning that powder to the supply system for reuse. Without recycling, 10–15% of sprayed powder would be wasted as dust in the exhaust stream and disposal costs.
The environmental and economic case is compelling. A medium-sized cabinet coating line spraying 1,500 kg of powder per day would otherwise waste 150–225 kg daily. Over a year, that translates to 55–82 tons of unnecessary landfill burden and material cost loss. For a coating line running 250 working days annually at average powder prices of $8–12 per kilogram, poor recovery alone can cost $44,000–$98,400 per year.
Beyond cost, regulatory pressure is tightening. Most developed markets now impose strict dust emission limits (typically 5–20 mg/m³ in exhaust air). A coating line without proper recovery cannot meet these standards, which means either massive capital investment in secondary filtration or inability to operate at all.
Why Recovery Quality Matters More Than Recovery Rate
Here's where most equipment specs mislead buyers: manufacturers often advertise "95% recovery rate" or "99% separation efficiency," but this typically refers only to how much powder physically separates from the airstream. It doesn't account for how much of that recovered powder is actually usable.
In our shop experience, we've seen recovered powder degrade through multiple mechanisms:
Particle fracture during the recovery process itself. Centrifugal and filter-based systems apply significant stress to powder particles, causing some to break into finer, lower-flowing fragments that clog supply lines or create inconsistent spray patterns.
Color contamination from incomplete cleaning between color changes. If your recovery system doesn't fully purge one color before the next run, you're introducing off-spec particles that ruin batch consistency.
Moisture reabsorption during storage. Recovered powder sitting in collection hoppers without active drying can pull humidity from humid air, causing the typical "powder won't flow" syndrome.
Agglomeration from powder-to-powder friction and compression in hoppers. Fine recovered particles bond into clumps that supply pumps can't move.
The result is that while your system might recover 93% of airborne powder, only 70–80% of that recovered powder is actually reusable without rework or disposal. The practical effective recovery rate is therefore 65–74%, not the advertised number.
This is why we always tell customers: don't buy based on the headline recovery percentage. Ask for reuse protocols, degradation data over 10 reuse cycles, and real-world test results from similar product types.
Current Mainstream Powder Recycling Technologies and How They Work
We work with three core recovery technologies on our lines. Each has distinct performance profiles, cost structures, and application strengths.
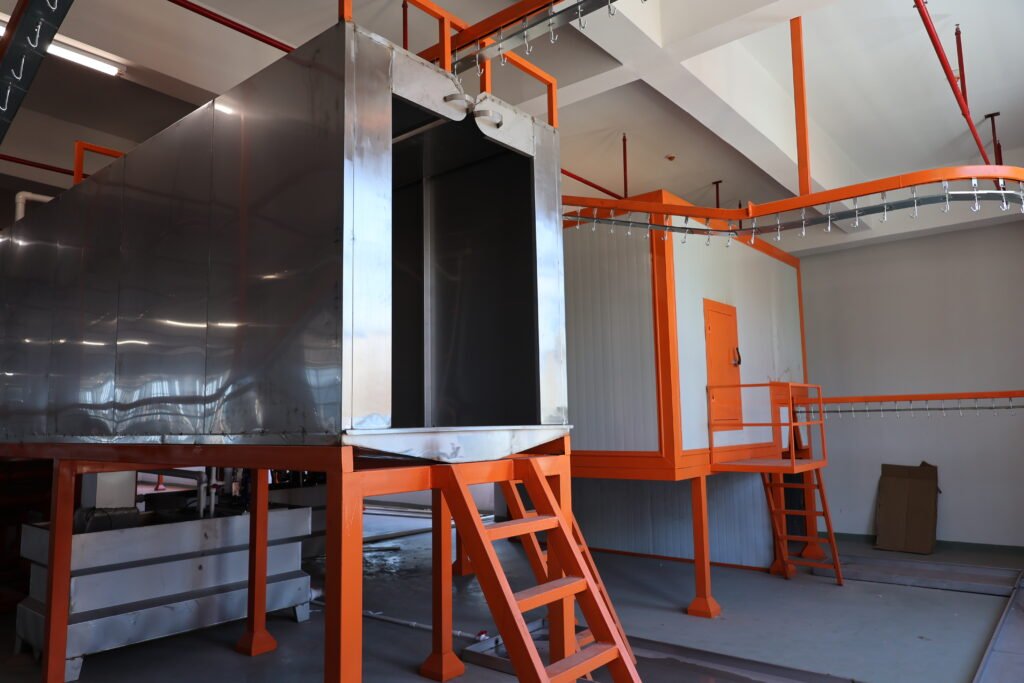
![powder coating recovery system efficiency comparison]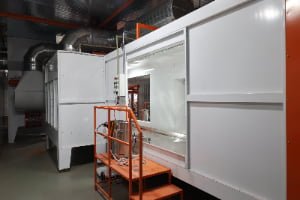
Cyclone Separation Systems
How it works: Powder-laden exhaust air enters a conical chamber tangentially at high velocity. Centrifugal force throws powder particles outward toward the chamber wall. Particles slide down to a collection hopper while cleaned air exits from the top center outlet.
Real-world performance:
- First-stage separation efficiency: 85–92%
- Particle size cutoff: typically 5 microns and above
- Pressure drop: 400–600 Pa
- Recovery rate by count: High for coarse particles, poor for ultra-fines
Advantages:
- Simple, robust, few moving parts
- Lower capital cost ($3,000–$8,000 for mid-range units)
- Minimal maintenance (occasional hopper cleaning)
- Works with most powder types
- Can handle relatively wet or moist air without immediate clogging
Limitations:
- Doesn't capture particles smaller than 5 microns
- Can create secondary dust cloud during hopper discharge
- Particle impact can cause attrition (powder degradation from collision with walls)
- Requires secondary filtration if environmental standards are strict
- Recovered powder quality degrades faster due to mechanical stress
Best suited for:
- Cabinet coating lines where product mix is stable (single or few colors)
- High-throughput operations where speed matters more than absolute perfection
- Operations with less stringent environmental limits
- Smaller shops without space for multi-stage systems
Real example: We built a cyclone recovery system for an Indonesian cabinet manufacturer spraying ~800 kg/day. First-pass recovery was 88%, but after three color changes and two weeks of operation, they noticed powder color creep and supply pump cavitation. The fine particles generated by cyclone impact had reached critical mass in the hopper.
Electrostatic Recovery Systems
How it works: Air leaving the spray booth passes through an electrode grid where remaining powder particles are recharged. These particles are then attracted to collection plates or walls (electrostatic precipitation). Collected powder slides into a hopper with minimal mechanical impact.
Real-world performance:
- Separation efficiency: 90–96% (finer particles included)
- Particle size cutoff: down to 2 microns
- Power consumption: 1–2 kW (modest electrical load)
- Recovery rate by count: Superior for fine particles
Advantages:
- Captures ultra-fine particles that cyclones miss
- Gentler on powder (less mechanical stress = less degradation)
- Can achieve very high recovery percentages if properly tuned
- Recovered powder maintains flow properties longer
- Works particularly well with epoxy and polyester systems
Limitations:
- Higher capital cost ($8,000–$18,000)
- Requires regular electrode cleaning (weekly or bi-weekly)
- Sensitive to air humidity (effectiveness drops above 60% RH)
- Voltage tuning required for different powder types
- If electrodes foul, recovery drops dramatically
- Not ideal for shops doing frequent color changes (recharge time needed)
Best suited for:
- High-precision coating operations (automotive, electronics, furniture)
- Operations with strict environmental permits
- Shops using mainly one or two powder types
- Environments where powder quality consistency is critical
Real example: A Turkish outdoor furniture maker using electrostatic recovery achieved 94% recovery on their first run. After three months of daily operation, electrode fouling (fine powder buildup on grids) reduced efficiency to 79%. After implementing weekly cleaning protocol, they returned to 92%, but the maintenance labor added ~$400/month to operating costs.
Filter-Based Recovery Systems
How it works: Exhaust air passes through one or more filter cartridges or bags with very fine pore sizes (typically 1–3 microns). Powder accumulates on the filter surface. Periodically, compressed air pulses ("backflushing" or "backblowing") dislodge accumulated powder, which falls into a collection hopper. Air continues to be filtered and exhausted clean.
Real-world performance:
- Separation efficiency: 95–99%+ (highest of the three)
- Particle size cutoff: 1 micron and below
- Pressure differential when clean: 200–300 Pa; when saturated: 800–1200 Pa
- Recovery rate by weight: Highest practical recovery achievable
Advantages:
- Highest real-world recovery rates (truly captures 95%+ usable powder)
- Recovered powder has minimal attrition because collection is gentle
- Reusable powder quality remains stable across many cycles
- Works in any humidity condition
- Most robust for frequent color changes (backflush effectively purges between colors)
- Excellent for environmental compliance (discharge air is genuinely clean)
Limitations:
- Highest capital cost ($12,000–$28,000+)
- Filter replacement required (every 6–12 months, $1,500–$3,500 per set)
- Compressed air infrastructure must be sized for backflushing (4–6 bar, significant volume)
- More complex controls and automation
- If compressed air quality is poor (wet or oily), filters clog prematurely
- Backflush cycle can introduce brief pressure spikes in system
Best suited for:
- High-volume production lines with strict quality requirements
- Multi-color operations requiring frequent changeovers
- Industries with stringent environmental regulations
- Operations where powder cost is significant enough to justify the investment
Real example: An Indian aluminum extrusion coating line we worked with installed a filter-based system. Initial investment was $22,000. Year one: powder cost dropped by $38,000 (85% reduction in new powder purchase), maintenance was $2,400. By year three, they had recovered the investment and were netting $32,000+ annually in savings, with virtually zero environmental complaints from local authorities.
Recovery Efficiency, Reuse Rates, and Real-World Performance Metrics
Understanding Effective Recovery Rate vs. Surface Recovery Rate
This distinction is the single most important thing to understand about powder recycling, and it's where most operator confusion starts.
Surface Recovery Rate is what the equipment physically separates and collects. A system advertised as "95% recovery" typically means 95% of sprayed powder doesn't escape as airborne dust. The other 5% might escape in exhaust air or lodge in hard-to-reach areas of the booth.
Effective Recovery Rate (what we prefer to track) is the percentage of collected powder that is actually reused without quality loss or rework. This accounts for:
- Particle degradation during recovery
- Color contamination across changeovers
- Moisture absorption during storage
- Hopper sedimentation and caking
- Supply chain losses (powder stuck in pipes, etc.)
Reusability Percentage is what remains after recovered powder has gone through multiple reuse cycles without degradation.
The Real Numbers:
From our direct observations:
- Cyclone systems: 88–92% surface recovery, but only 65–75% effective recovery (12–27% loss to degradation and contamination)
- Electrostatic systems: 92–96% surface recovery, 75–85% effective recovery (11–23% loss, primarily from electrode fouling and humidity sensitivity)
- Filter systems: 96–99% surface recovery, 85–95% effective recovery (4–14% loss, minimal degradation)
This means:
- A cyclone system claiming "92% recovery" actually delivers ~67% usable powder back to your line
- An electrostatic system at "94% recovery" delivers ~80% usable powder
- A filter system at "97% recovery" delivers ~91% usable powder
When calculating ROI, you must use effective recovery rate, not surface recovery rate.
![industrial powder coating recycling line setup]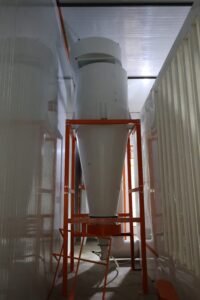
Typical Efficiency Levels and Industry Benchmarks
Benchmark Data from Our Field Operations:
| System Type | Surface Recovery % | Effective Recovery % | Useful Reuse Cycles | Color Changeover Time | Maintenance Interval |
|---|---|---|---|---|---|
| Cyclone (Single Stage) | 88–92 | 65–75 | 3–5 | 45–60 min | Weekly |
| Cyclone + Secondary Filter | 91–95 | 72–82 | 5–8 | 30–45 min | Bi-weekly |
| Electrostatic (Properly Tuned) | 92–96 | 75–85 | 6–10 | 20–30 min | Weekly cleaning |
| Filter-Based (Cartridge) | 96–99 | 85–95 | 10–15+ | 10–20 min | Monthly checks |
What Impacts These Numbers:
-
Powder Type & Particle Size Distribution
- Finer powders (median 5–10 microns): cyclones are less effective; filters shine
- Coarser powders (15–25 microns): cyclones work adequately; all systems perform well
- Polyester epoxy blends: more robust recovery across all systems
- Specialty systems (polyurethane, acrylic): require gentler, filter-based recovery
-
Environmental Conditions
- Humidity above 55%: electrostatic and cyclone efficiency drops; filters unaffected
- Temperature extremes: can affect powder charge stability; filters handle better
- Ambient dust in booth: increases false loading on filters; requires more frequent backflush
-
Spray Booth Design & Exhaust Airflow
- Booth air velocity too high: powder carries past recovery equipment; reduce air volume or add pre-separation stage
- Uneven airflow: creates dead zones where powder settles; optimize duct design
- Distance from spray zone to recovery inlet: longer distances allow more settling and separation before recovery; reduces recovery equipment load
-
Operator Discipline
- Proper equipment maintenance: electrostatic electrodes cleaned on schedule → 3–5% efficiency gain
- Timely filter changes: filter replacement at saturation (not beyond) → 4–8% efficiency maintenance
- Correct compressed air quality: dry, oil-free air → 5–10% efficiency gain for filter systems
-
Production Variables
- Color change frequency: more changes = more opportunity for cross-contamination
- Spray pattern consistency: unstable gun parameters = more overspray and recovery load
- Booth coverage area: oversized booths for small workpieces = poor recovery ratios
Key Factors Affecting Powder Recovery Performance
Powder Type and Coating System Compatibility
From our work with cabinet makers in Foshan and aluminum extrusion shops in India, I can tell you that recovery system selection must start with powder chemistry, not equipment preference.
Epoxy Powders (common in electrical cabinets, industrial equipment):
- Particle size typically 10–20 microns
- Electric charge retention: Excellent (holds static charge well)
- Recovery compatibility: All three systems work; cyclones adequate, filters optimal
- Reusability: 4–8 reuse cycles typical before quality loss
Polyester Powders (outdoor furniture, automotive, architectural):
- Particle size typically 5–15 microns
- Electric charge retention: Good, but slightly lower than epoxy
- Recovery compatibility: Electrostatic and filter systems preferred; cyclone recovery degrades quality
- Reusability: 6–12 reuse cycles; film-forming properties remain stable
Polyurethane/Acrylic Powders (high-end furniture, electronics):
- Particle size typically 3–10 microns (finer)
- Electric charge retention: Good but sensitive to humidity
- Recovery compatibility: Filter-based only; cyclone impact causes unacceptable degradation
- Reusability: 8–15 reuse cycles; highly sensitive to moisture
Specialty Systems (conductive, electrostatic-dissipative, transparent):
- Particle size: Often engineered to be uniform, typically 5–12 microns
- Electric charge: Critical; must be preserved; electrostatic stress during recovery is problematic
- Recovery compatibility: Filter-based systems strongly preferred
- Reusability: Variable; some specialty powders can be reused 15+times, others only 2–3
Practical Example: We consulted with a Turkish furniture producer who was using a cyclone recovery system for polyurethane powder coating. After 2–3 reuse cycles, they reported fine particle buildup in spray lines, color inconsistency, and hardness loss in cured coatings. Root cause: cyclone attrition was fragmenting the finer polyurethane particles, and those fragments were degrading quality. Solution: upgrade to filter-based recovery. Result: consistent performance for 10+ cycles per batch.
Compressed Air Quality and Supporting Infrastructure
Here's something that gets overlooked constantly: powder recovery system failures usually aren't the recovery system's fault. They're air system faults.
Why Compressed Air Quality is Critical:
Electrostatic and filter-based recovery systems depend on clean, dry compressed air for:
- Electrode discharge and recharging (electrostatic systems)
- Filter backflushing pulses (filter systems)
- Powder flow in collection and supply lines
- Preventing moisture-induced powder clumping
Common Air Quality Problems We've Encountered:
-
Moisture in air (relative humidity > 70% in discharge):
- Powder absorbs moisture → grains swell and agglomerate
- Result: flow blockages in supply lines, pump cavitation, spotty coverage
- Fix: install desiccant dryer; maintain discharge humidity below 40%
- Cost: $2,000–$5,000 for adequate drying; $300–$600/year maintenance
-
Oil carryover from compressor:
- Oil residue coats powder particles → reduces charge acceptance
- Result: poor coverage, excessive overspray, recovery system overload
- Fix: install oil/water separator, coalescing filters, regular trap draining
- Cost: $1,500–$3,000 initial; $200–$400/year maintenance
-
Particulate contamination (dirt, rust, scale from air lines):
- Contaminants lodge in filter media → accelerates clogging
- Contaminants in powder supply → spray gun nozzle wear, uneven spray
- Fix: multi-stage filtration (5 micron pre-filter, 1 micron main filter)
- Cost: $1,000–$2,500 initial; $400–$800/year filter replacement
-
Insufficient air volume for backflushing:
- Filter cartridges don't purge completely → powder residue builds up
- Result: filter saturation, pressure rise, eventual shutdown
- Fix: upsize compressor or air receiver tank; typical requirement is 4–6 bar at 500–1000 L/min
- Cost: $8,000–$15,000 for additional compressor capacity
What We Always Recommend:
Before upgrading recovery equipment, audit your compressed air system:
- Measure pressure and humidity at the recovery equipment inlet (not at compressor discharge)
- Check for line leaks (listen for hissing; measure pressure drop over 30 minutes at idle)
- Install pressure gauge and humidity sensor to create a baseline
- Implement a preventive maintenance schedule: filter changes quarterly, trap drainage weekly, compressor oil change per manufacturer specs
In one Indian project, a client's filter recovery system was underperforming at 78% effective recovery despite manufacturer claims of 96%. Investigation revealed inadequate air pressure (2.8 bar instead of specified 4.5 bar) and 65% humidity in the discharge. After adding a 7.5 kW compressor and upgrading the drying system, recovery climbed to 91% effective within two weeks.
Powder Quality Degradation and Reuse Cycles
This is where the real cost picture emerges.
What Happens to Powder During Recovery and Reuse:
-
Particle fracturing (mechanical impact):
- Cyclone systems: particles hit walls at high velocity; some fracture into fines
- Impact severity: higher for finer, more brittle powders (acrylics) vs. softer powders (polyester)
- Cumulative effect: with each cycle, fines fraction increases
-
Charge loss and contamination:
- Recovered powder mixes with residual old particles from previous cycles
- Color bleeding: traces of prior batch colors remain in hoppers/lines
- Triboelectric properties degrade: mixed particle ages don't charge uniformly
-
Moisture absorption:
- Powder stored in collection hoppers without active drying slowly reabsorbs moisture
- At 50% RH, typical powder absorbs 0.3–0.8% moisture per 48 hours
- Effect: reduced charge acceptance, flowability loss, application inconsistency
-
Fusion and agglomeration:
- Fine particles from degradation bond together under storage pressure
- Gravity sedimentation: coarser particles settle; fines float to top
- Result: non-uniform particle size in next spray batch
Typical Reusability Schedules (Based on Our Field Data):
| System Type | Powder Type | Typical Reuse Cycles | Quality Loss per Cycle | Recommended Discard Point |
|---|---|---|---|---|
| Cyclone | Epoxy | 3–5 | 3–5% | After 5 |
| Cyclone | Polyester | 4–6 | 2–4% | After 6 |
| Electrostatic | Epoxy | 6–8 | 2–3% | After 8 |
| Electrostatic | Polyester | 7–10 | 1.5–2.5% | After 10 |
| Filter | Epoxy | 10–15 | 0.5–1.5% | After 15 |
| Filter | Polyester | 12–18 | 0.5–1.5% | After 18 |
| Filter | Polyurethane | 8–12 | 1–2% | After 12 |
What This Means for Cost:
If you're spraying 1,000 kg of powder per production day across 250 working days (250,000 kg/year) at a cost of $10/kg:
Scenario A: Cyclone System with 70% Effective Recovery
- New powder needed: 250,000 kg × 30% (loss factor) = 75,000 kg
- Annual new powder cost: $750,000
- Recovered powder reuse cycles: 4 average
- Powder scrapped/degraded: 75,000 kg × 25% (degradation loss) = 18,750 kg
- Disposal cost: $18,750 × $0.50/kg = $9,375
- Total annual powder cost: $759,375
Scenario B: Filter System with 90% Effective Recovery
- New powder needed: 250,000 kg × 10% (loss factor) = 25,000 kg
- Annual new powder cost: $250,000
- Recovered powder reuse cycles: 13 average
- Powder scrapped/degraded: 25,000 kg × 5% (degradation loss) = 1,250 kg
- Disposal cost: $1,250 × $0.50/kg = $625
- Total annual powder cost: $250,625
- Annual savings vs. Cyclone: $508,750
Equipment cost differential (filter system $20,000 more than cyclone) is recovered in 2 weeks of operation.
Cost Analysis: Investment, Operating Expenses, and ROI
Equipment and Installation Costs
Baseline System Costs (Mid-Range Industrial Scale):
| Component | Cyclone | Electrostatic | Filter-Based |
|---|---|---|---|
| Recovery unit hardware | $4,000–$6,000 | $8,000–$12,000 | $14,000–$22,000 |
| Collection hopper & accessories | $1,500–$2,500 | $2,000–$3,500 | $2,500–$4,000 |
| Ducting & connections | $2,000–$4,000 | $3,000–$5,000 | $3,000–$5,000 |
| Compressed air setup (if new) | $1,500–$3,000 | $2,000–$4,000 | $3,000–$6,000 |
| Control system & safety devices | $1,000–$2,000 | $1,500–$3,000 | $2,000–$4,000 |
| Installation labor (2–5 days) | $2,000–$5,000 | $3,000–$7,000 | $4,000–$8,000 |
| Total Installed Cost | $12,000–$22,500 | $19,500–$34,500 | $28,500–$49,000 |
Why Cost Varies:
- Booth size and configuration
- Existing compressed air infrastructure capacity
- Electrical infrastructure availability (phase, voltage, grounding)
- Local labor rates and installation complexity
- Whether compressed air drying equipment is included
Energy Consumption and Maintenance Considerations
Ongoing Operational Costs:
-
Electricity (primary operational driver):
- Cyclone systems: 2–4 kW (main exhaust fan + pilot), running 8–10 hours/day
- Electrostatic systems: 3–5 kW (exhaust fan + electrode system + control)
- Filter systems: 4–6 kW (exhaust fan + backflush compressor duty + controls)
- Annual electricity cost (assuming $0.12/kWh):
- Cyclone: $480–$1,152/year
- Electrostatic: $720–$1,440/year
- Filter: $960–$1,728/year
-
Compressed air (particularly for filter backflushing):
- Backflush events: typically 1–2 per hour during production
- Air volume per pulse: 50–100 L at 5 bar
- System efficiency loss: 10–15% of total compressor output
- Estimated cost (at $0.08 per 1,000 L compressed):
- Cyclone + electrostatic: negligible (pilot air only), $100–$300/year
- Filter-based: $400–$800/year
-
Consumables & Maintenance:
- Cyclone: Minimal wear parts; hopper emptying labor
- Cost: $200–$500/year
- Electrostatic: Electrode cleaning supplies, occasional replacement
- Cost: $600–$1,200/year
- Filter: Cartridge replacements (1–2 sets/year), seal kits, cleaning media
- Cost: $2,000–$4,000/year
- Cyclone: Minimal wear parts; hopper emptying labor
Total Annual Operating Cost (Excluding Powder Cost):
- Cyclone: $800–$1,950/year
- Electrostatic: $1,400–$2,700/year
- Filter: $3,360–$6,500/year
![powder coating efficiency table and metrics]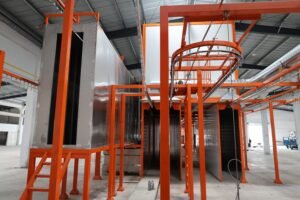
Calculating Return on Investment and Payback Period
The Real ROI Calculation (Not Just Equipment Payoff):
ROI for powder recovery must account for powder cost savings, not just equipment amortization.
Example: Cabinet Coating Line
Operating Profile:
- Daily powder usage: 1,200 kg
- Production days per year: 250
- Annual powder consumption: 300,000 kg
- Powder cost: $9.50/kg
- Annual powder budget (without recovery): $2,850,000
- Current state: 45% recovery (poor cyclone system or manual disposal)
Scenario 1: Upgrade from 45% to 70% Recovery (Install Electrostatic)
- Equipment cost: $26,000 (installed)
- Annual operating cost (incremental): $1,400
- Powder recovery improvement: 25 percentage points
- Annual powder savings calculation:
- Current waste: 55% of 300,000 kg = 165,000 kg × $9.50 = $1,567,500
- New waste: 30% of 300,000 kg = 90,000 kg × $9.50 = $855,000
- Annual savings: $712,500 (from 25% improved recovery × 300,000 kg annual use)
- Payback period: 0.04 years = 17 days
- Year 1 net benefit: $711,100 (savings minus operating cost)
- 5-year cumulative benefit: $3,497,500
Scenario 2: Upgrade from 45% to 90% Recovery (Install Filter System)
- Equipment cost: $38,000 (installed)
- Annual operating cost (incremental): $3,400
- Powder recovery improvement: 45 percentage points
- Annual powder savings calculation:
- New waste: 10% of 300,000 kg = 30,000 kg × $9.50 = $285,000
- Annual savings: $1,282,500 (from 45% improved recovery)
- Payback period: 0.03 years = 11 days
- Year 1 net benefit: $1,279,100
- 5-year cumulative benefit: $6,175,500
Key Insight: For high-volume coating lines, the payback period for recovery system upgrades is measured in days or weeks, not months or years. The bottle neck is typically not ROI justification—it's capital availability and installation scheduling.
Breakeven Analysis by Daily Production Volume:
At what daily production volume does each recovery system payback its capital cost within one year?
- Cyclone system ($17,500 cost): Requires 22 kg/day powder use; virtually all production lines exceed this
- Electrostatic system ($26,000 cost): Requires 32 kg/day powder use; nearly all industrial lines exceed this
- Filter system ($38,000 cost): Requires 47 kg/day powder use; most professional lines exceed this
Conclusion: Powder recovery systems are almost universally economically justified for production volumes above 50 kg/day of powder consumption. Smaller shops or batch operations below this threshold should evaluate based on environmental compliance needs rather than purely economic ROI.
Technology Gaps and Competitive Landscape: Global Perspectives
Where Current Technology Falls Short
From consulting on lines across Europe, Asia, and North Africa, I've identified persistent gaps:
1. Powder Blend and Transition Management
Current recovery systems treat recovered powder as uniform material. In reality, multi-color production creates partially mixed batches in hoppers. A cabinet line switching from white to black leaves trace white particles; those white specks end up in the black batch and create quality defects.
Gap: No recovery system today has integrated real-time spectrophotometry or particle sorting. Some European OEMs are prototyping this, but it's still lab-stage.
Impact: Shops doing frequent color changes still discard 3–7% of recovered powder as off-spec.
2. Degradation Prediction and Reuse Cycle Management
Operators typically guess when to scrap recovered powder. Some run batches until quality complaints arrive; others conservatively discard early and waste recovered material.
Gap: No standardized testing or predictive model for remaining powder viability. Some Japanese manufacturers are researching charge acceptance decay curves, but real-time monitoring hasn't reached market.
Impact: Most operations either leave money on the table (discarding good powder) or sacrifice quality (reusing degraded powder too many times).
3. Humidity-Sensitive Operations in Tropical Regions
Powder recovery in India, Indonesia, and Southeast Asia faces a fundamental challenge: ambient humidity often exceeds 70%, even in air-conditioned spaces. Electrostatic recovery efficiency collapses; filters require constant maintenance.
Gap: No mainstream system includes integrated humidity control at the recovery point. Most require external infrastructure.
Impact: Shops in tropical regions see 20–30% efficiency loss compared to temperate-climate peers, all else equal.
4. Ultra-Fine Powder Handling
Emerging applications (high-gloss finishes, fine electronics coating, specialty automotive) require powders with median particle size 3–5 microns. Filter systems handle these, but at the cost of 40–60% more frequent cartridge changes and corresponding disposal.
Gap: No cost-effective sub-2-micron recovery technology exists outside of filter systems. Electrostatic and cyclone design hasn't adapted to this category.
Impact: High-spec operations accept 50–80% higher recovery maintenance costs or limit adoption of superior powder formulations.
Global Competitive Landscape
European Makers (German, Italian brands dominant):
- Strong in filter-based systems and automation controls
- Focus on environmental compliance and Industry 4.0 integration
- Higher price point ($35,000–$60,000 for full recovery suite)
- Strong aftermarket parts availability
- Example: Nordson, Gema, Sames Kremlin
Asian Manufacturers (China, Taiwan, India):
- Growing strength in cost-effective cyclone and basic electrostatic systems
- Increasing adoption in Southeast Asian and South Asian markets
- Price point: $15,000–$35,000
- Variable aftermarket support; improving quality
- Example: Chinese OEMs not widely named in Western markets; some Turkish/Indian assemblers
Regional Specialization:
- North America: Mix of European premium brands and localized suppliers
- Europe: Premium European equipment dominates; aftermarket highly developed
- Asia-Pacific: Increasingly competitive; Chinese and Indian brands gaining share; pricing pressure
- Middle East/Africa: Heavy reliance on used equipment and refurbished systems from developed markets
Trend: Consolidation is occurring. Smaller regional suppliers are being acquired by larger global OEMs (Nordson acquiring competitors; Graco expanding). This is driving standardization of technology but also reducing localized support.
Future Development Directions: Automation, Intelligence, and Sustainability
Near-term (1–2 years)
Real-time powder quality sensing:
We're seeing prototype systems from European OEMs using optical sorters (similar to coffee grain sorting technology) to detect color deviation and particle size distribution in recovered powder. Early systems can segregate off-spec material with 92% accuracy. Cost premium: $5,000–$8,000. Timeline to commercialization: 12–18 months.
IoT monitoring and predictive maintenance:
Filter saturation sensors, pressure differential monitoring, and electrode fouling detection are becoming standard on premium equipment. Data feeds into cloud dashboards allowing remote diagnostics. This reduces unplanned downtime by 15–25% in early deployments.
Modular, quick-swap filter cartridges:
Bayonet and toolless connection systems are enabling cartridge changes in <5 minutes without specialized labor. This will shift maintenance from quarterly professional service to operator-level weekly changes—reducing maintenance cost by 30–40%.
Mid-term (3–5 years)
Hybrid recovery systems:
We expect market introduction of dual-stage systems combining cyclone primary separation with filter secondary capture, tuned for specific powder types. This would offer 88–94% effective recovery at mid-range cost ($22,000–$32,000). Currently, only custom systems achieve this; standardization is coming.
Humidity-adaptive recovery:
Electrostatic systems with active humidity control (inline dehumidifier or moisture separator) will unlock performance in tropical regions. Expected system cost: $28,000–$40,000. This addresses the India/Southeast Asia market gap.
Powder reuse algorithms:
Machine learning models trained on particle charge decay data, humidity history, and application results will predict remaining reuse cycles for each powder batch. Systems will automatically flag when to scrap vs. when to recycle. Accuracy target: 94%+.
Longer-term (5–10 years)
Closed-loop powder recycling with chemical reconditioning:
Some research teams are exploring low-temperature reconditioning techniques to restore charge acceptance and flow properties to degraded powder. If commercialized, this could extend reuse cycles from 10–15 to 20–30, fundamentally changing powder economics. Currently proof-of-concept; commercialization uncertain.
Nanotechnology-enhanced recovery:
Experimental systems using nanostructured collection surfaces show 1–2% efficiency gains in preliminary trials. If scalable, this could push filter systems from 95–99% to 97–99.5% effective recovery.
Fully autonomous powder management:
Integration of recovery, storage, drying, quality testing, and supply into a single automated module with minimal human intervention. Target: <1 hour per week operator time for systems currently requiring 3–4 hours. Timeline: 7–10 years out; substantial engineering still required.
How to Choose the Right Powder Recovery System for Your Operation
Decision Framework
Step 1: Quantify Your Current Powder Loss
Calculate current annual powder cost and waste:
- Daily powder consumption (kg) × 365 days = annual use
- Multiply by powder cost/kg = annual powder budget
- Estimate current recovery (ask your booth vendor or infer from disposal records): typically 40–60% for older systems, 60–80% for modern systems
- Wasted powder cost = annual budget × (100% – current recovery %)
If wasted powder cost > $50,000/year, recovery upgrade is economically justified.
Step 2: Assess Your Production Profile
| Factor | Cyclone-Suitable | Electrostatic-Suitable | Filter-Suitable |
|---|---|---|---|
| Color changes per week | 1–2 | 2–4 | 4+ |
| Humidity in booth | 40–60% | 40–60% | Any |
| Powder particle size (median) | 10–20 μm | 5–15 μm | 3–25 μm (all sizes) |
| Daily powder volume | <500 kg | 500–1500 kg | 1500+ kg (or <100 kg with high precision) |
| Environmental compliance | Standard | Moderate | Strict |
| Operator skill level | Low | Medium | Medium-High |
Step 3: Calculate 5-Year Total Cost of Ownership
For each system type appropriate to your profile:
- Equipment cost (installed)
- Annual operating costs (electricity, compressed air, maintenance, consumables)
- Annual powder cost savings (from improved recovery)
- Minus: annual operator labor for maintenance
- 5-year total = sum of above annualized
Select the system with lowest 5-year total cost, with secondary preference for reliability and support infrastructure in your region.
Step 4: Validate Vendor Track Record
Ask prospective suppliers:
- Real-world effective recovery rate, not just surface recovery rate (request independent test data)
- Case studies in your region/industry
- Warranty terms and parts availability timeline
- Onsite commissioning and operator training included?
- Response time for technical support
Real-World Selection Example: Indian Aluminum Extrusion Shop
Profile:
- Daily powder: 950 kg
- Annual cost at $10/kg: $2,375,000
- Current recovery: 55% (ineffective older system)
- Humidity: 65–75% (monsoon season)
- Color variety: 8 common shades, 2–3 color changes per week
Analysis:
| Option | Cyclone | Electrostatic | Filter |
|---|---|---|---|
| Equipment cost | $18,000 | $28,000 | $42,000 |
| Year 1 powder savings | $380,000 | $550,000 | $710,000 |
| Annual op cost | $1,000 | $1,600 | $4,000 |
| Year 1 net benefit | $379,000 | $548,400 | $706,000 |
| 5-year total cost | $38,000 | $56,000 | $74,000 |
| 5-year net benefit | $1,850,000 | $2,630,000 | $3,406,000 |
| Payback (months) | 1.4 | 0.6 | 0.7 |
Recommendation: Filter system, despite higher equipment cost. Reasoning:
- Humidity in region degrades electrostatic efficiency by 15–20% relative to temperate regions
- Frequent color changes make filter faster changeovers valuable
If you're evaluating coating solutions for a new production line or troubleshooting failures on an existing one, the data-driven approach is to establish your durability requirement, define the environment, then reverse-engineer the coating method and process controls needed to meet it. Don't start with "we'll use e-coat" and hope it works. Start with "we need 10-year outdoor durability" and determine whether e-coat is even viable.
I'm happy to discuss your specific application. Whether you're designing a new spray system, troubleshooting coating failures, or evaluating supplier capabilities, the engineering conversation should be grounded in these real-world factors—not marketing claims.
Reach out to me at WhatsApp: +8618064668879 or Email: ketumachinery@gmail.com if you want to discuss your coating challenges or line design.